Who’s on the Hook for the Palms?

Red Rock Resorts has set a big ROI target for its Palms Casino Resort. What started as a $312.5 million acquisition with $35 million of EBITDA expected in the first full year of RRR ownership, has now become a $1 billion project, with a capex budget that has increased to $690 million over the past year-and-a-half.

Can they get there?

Investors should ask management to set clear markers: who will be held accountable if the post-renovation Palms doesn’t generate the kind of ROI management has projected?

Read out report: Who’s on the Hook for the Palms?

Withhold the Vote 2018: Failure to Sunset Perpetual Dual-Class Stock

We encourage Red Rock Resorts shareholders to withhold authority to vote on their proxy card for the company’s board of directors – Frank J. Fertitta III, Lorenzo J. Fertitta, Robert A. Cashell, Jr., Robert E. Lewis, and James E. Nave, D.V.M. – at the upcoming annual stockholders meeting on June 14.

The many problems arising from the company’s perpetual dual-class stock make it necessary for outside shareholders to withhold their votes, especially after the company has made no attempt to address the significant shareholder discontent expressed at last year’s annual meeting.

Perpetual dual-class shares trade at a significant discount, risk index exclusion, and are opposed by major shareholder advocacy groups.

Read our report, Withhold the Vote 2018: Failure to Sunset Perpetual Dual-Class Stock

Selected Results: 2017 Corporate Governance Survey of Red Rock Shareholders

Following shareholder discontent at Red Rock’s annual meeting this July, in which 9% to 16% of equity holders withheld from the directors, we decided to survey Red Rock investors about their corporate governance issues. The survey this year measured shareholder sentiment toward Red Rock’s takeover defenses and features of its board of directors. We believe these topics are particularly important following another year of strong M&A activity in the gaming industry.

Despite the dissatisfaction expressed by shareholders and the negative voting recommendations from Institutional Shareholder Services for Red Rock’s entire board of directors surrounding the 2017 annual meeting, the company has not announced plans to remove, sunset, or put to a vote its takeover defenses. Nor has the company done anything to resolve its problematic board structure, which ISS gave its highest governance risk rating of 10 (as of June 19, 2017).[i]

The results of our survey reveal shareholder respondents expressed consensus for a hybrid format for the annual general meeting, took issue with the dual-class capital structure and other takeover defenses, and shared their preference for a more diverse board, an independent board chair, and their doubt regarding shareholder representation on the board.

See the selected results of the corporate governance survey below:

supervoting

preferred-stock tra supermajority written-consent special-meetings agms board-diversity independent-chair shareholder-representation

Notes

[i] Institutional Shareholder Services, “Proxy Alert: Red Rock Resorts, Inc.,” June 19, 2017, original publication date June 16, 2017, p. 1.

Baron’s Sunk Cost Trap: Red Rock Resorts

Over the past year, Baron has been building a position in Red Rock Resorts, Inc. (NASDAQ: RRR) and is now the second largest outside investor, owning just over 10% of the publicly listed Class A shares of RRR. Red Rock’s shares have underperformed both the market and its peers, year-to-date. Baron’s efforts to double down on Red Rock’s stagnant stock suggest its stock pickers have fallen into a sunk cost trap, unwilling to recognize the opportunity cost they’ve incurred by putting millions more of their clients’ money in RRR over the past year.

Sunken Costs
Baron filed a 13G on October 10, 2017, announcing its 10.42% ownership of Red Rock Resorts, Inc.’s Class A shares outstanding.[i] Baron began developing its position in Red Rock following the latter’s IPO in April 2016. As early as June 30, 2016, Baron reported owning 3,605,258 (or approximately 8.7% at the time) of Red Rock’s Class A shares outstanding.[ii]

Baron’s stock pickers slowly increased the firm’s holdings in Red Rock through late 2016 and early 2017, with significant increases both in the 2Q17 (29% increase in number of shares since previous 13F) and in a 13G filed on October 10th, 2017 (28% increase) (Chart 1).[iii],[iv],[v] What value do Baron’s stock pickers see in a stagnant, underperforming security such as Red Rock?

Chart 1: RRR Share Price and Baron’s RRR Class A Ownership
171109_chart-1_bamco-rrr-ownership

Red Rock’s share price has underperformed the markets year-to-date. As of the closing prices on November 8, 2017, the NASDAQ composite index is up 24.0% and the S&P 500 is up 14.3%, while Red Rock’s share price has increased by 11.0%. On the other hand, Red Rock’s peers have significantly outperformed the markets year-to-date (Chart 2).

Chart 2: Share Price Performance of RRR and Industry Peers (YTD)
171108_yahoofinance_rrrpeers

Opportunity Cost
What would it look like if instead of sinking more money into Red Rock, Baron’s portfolio managers had chosen to invest in one of its peers? Baron’s reported ownership of 3,900,959 of Red Rock’s Class A shares as of December 31, 2016.[vi] The value of this number of shares at the start of 2017 was approximately $91 million.[vii] Baron’s decision to stay invested in Red Rock came with a significant opportunity cost (Table 1). If Baron had bought shares in any of these other gaming companies instead of Red Rock Resorts, it would have seen a sizable YTD gain instead of a negligible return from RRR Class A shares.

Table 1: Market Appreciation and Opportunity Cost YTD (through 11/8/17)

Company Share Price
YTD % change (through 11/8/17)
Potential Value
(as of 11/8/17)
Opportunity Cost
Eldorado Resorts 67.3% $152 mm $51 mm
Boyd Gaming 42.4% $130 mm $29 mm
Golden Entertainment 154.4% $232 mm $130 mm
Pinnacle Entertainment 81.6% $165 mm $64 mm
Penn National 91.1% $173 mm $73 mm

What makes Baron’s position in RRR even more interesting is that the firm has nearly doubled (82% increase) its ownership of Red Rock’s Class A shares from the beginning of the year until its latest filing on October 10, 2017.[viii],[ix]  Given the opportunity cost of its RRR investment, Baron’s stake will need to generate a much greater return than what can be expected from RRR’s current 12-month consensus price target of $28.50 for the firm’s position to make financial sense.[x] Whatever Baron’s internal price target for RRR might be, the firm must assume that RRR will greatly outpace its gaming peers over a reasonable investment period.

Baron’s fund managers should not be satisfied with seeing RRR reach $28.50 by the end of 2018, considering the much bigger returns it could have gotten if it had invested in one of its peers.

Notes
[i] BAMCO, Inc., SEC Form 13G, filed on October 10, 2017.
[ii] BAMCO, Inc., SEC Form 13F, Information Table, filed on August 14, 2016, as of June 30, 2016.
[iii] BAMCO, Inc., SEC Form 13F, Information Table, filed on May 15, 2017, as of March 31, 2017.
[iv] BAMCO, Inc., SEC Form 13F, Information Table, filed on August 14, 2017, as of June 30, 2017.
[v] BAMCO, Inc., SEC Form 13G, filed on October 10, 2017.
[vi] BAMCO, Inc., SEC Form 13F, Information Table, filed on February 14, 2017, as of December 31, 2016.
[vii] Red Rock’s opening share price on January 3, 2017 was $23.36.
Yahoo Finance, “Red Rock Resorts,” Historical Data, website, accessed on October 3, 2017. https://finance.yahoo.com/quote/RRR/history?p=RRR
[viii] BAMCO, Inc., SEC Form 13F, Information Table, filed on February 14, 2017, as of December 31, 2016.
[ix] BAMCO, Inc., SEC Form 13G, filed on October 10, 2017.
[x] Consensus Price Target as reported by NASDAQ’s website. Accessed on November 9, 2017. http://www.nasdaq.com/symbol/rrr/analyst-research

Opportunity Cost: The Case of Cohen & Steers’ Investment in Red Rock Resorts

Cohen & Steers, Inc. (NYSE: CNS) filed a Schedule 13G on December 12, 2016, announcing its beneficial ownership (at the time 15.94% of Class A shares) in Red Rock Resorts. This was an interesting move by Cohen & Steers, which is often praised as the “king of REITs”[i],[ii] and self-described as “pioneers in REIT investing.”[iii] The company has no other investments in the gaming industry besides the REIT Gaming and Leisure Properties.[iv] However, since Red Rock is not a REIT and has not announced any plans to convert its assets into a REIT, why did CNS take such a large stake in Red Rock and continue to hold on to it? Red Rock’s stock (the publicly-traded Class A shares) has struggled year-to-date compared to the market and its regional gaming peers. CNS investors should ask how long the firm is willing to wait for its bet on Red Rock to pay off.

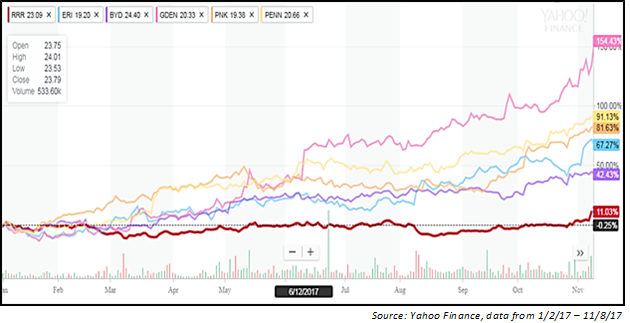
Red Rock’s share price has underperformed the markets year-to-date. As of the closing prices on September 29, 2017, the NASDAQ composite index is up 19.7%, the S&P 500 is up 11.9%, and the Russell 2000 is up 9.8%, while Red Rock’s share price has declined by 0.86%. On the other hand, Red Rock’s peers have significantly outperformed the markets year-to-date (Table 1).

Table 1: Share Price % Change YTD (through 9/29/17)

Company or Index

Share price (1/3/17, open)

Share price (9/29/2017, close)

Year-to-date % change

Red Rock Resorts

$23.36

$23.16

-0.86%

Eldorado Resorts

$17.10

$25.65

50.0%

Boyd Gaming

$20.40

$26.05

27.7%

Golden Entertainment

$12.24

$24.38

99.2%

Pinnacle Entertainment

$14.65

$21.31

45.5%

Penn National

$13.90

$23.39

68.3%

Gaming and Leisure Prop (REIT)

$30.77

$36.89

19.9%

MGM Growth Properties (REIT)

$25.31

$30.21

19.4%

NASDAQ composite index

$5,425.62

$6,495.96

19.7%

Dow Jones Industrial Average

$19,872.86

$22,405.03

12.7%

S&P 500

$2,251.57

$2,519.36

11.9%

Russell 2000

$1,357.99

$1490.86

9.78%

Source: Yahoo Finance

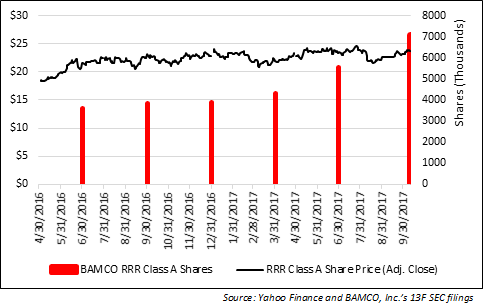
Cohen & Steers’ 13G filed on December 12, 2016, shows the company owned 9,739,009 of Red Rock’s Class A shares. At the start of 2017, the value of these shares was approximately $228 million.[v] Red Rock’s share price has not appreciated year-to-date (through 3Q17). If Cohen & Steers had put this $228 million investment in nearly any other gaming company, including the two actual gaming REITs, it would have generated sizable returns for its investors and clients (Table 2). Holding onto Red Rock’s Class A shares had a significant opportunity cost for Cohen & Steers.

Table 2: Market Appreciation and Opportunity Cost YTD (through 9/29/17)

Company

Share Price
YTD % change (9/29/17)

Potential Value
(9/29/17)

Opportunity Costs

Eldorado Resorts

50.0%

$342 mm

$116 mm

Boyd Gaming

27.7%

$291 mm

$65 mm

Golden Entertainment

99.2%

$454 mm

$228 mm

Pinnacle Entertainment

45.5%

$332 mm

$106 mm

Penn National

68.3%

$384 mm

$158 mm

Gaming and Leisure Prop (REIT)

19.9%

$273 mm

$47 mm

MGM Growth Properties (REIT)

19.4%

$272 mm

$46 mm

Red Rock’s investment risks are very clear, such as its limited geography diversity, dependence on Las Vegas macro fundamentals, and its long-held but vacant land holdings with few shovel-ready development plans. In its S-1 filed on October 26, 2016, Red Rock states:

We depend on the Las Vegas locals and repeat visitor markets as our key markets, which subjects us to greater risks than a gaming company with more diverse operations.

Except for fees from its set-to-expire management contracts at Gun Lake and Graton ($111 million in 2016)[vi], Red Rock relies on the Las Vegas valley for all of its revenues. In 2016, 92% of the company’s consolidated net revenues were from its Las Vegas operations.[vii] This should be a red flag for investors skeptical about the Las Vegas locals market recovery. (A notable economist and gaming analyst recently cast doubt on the strong growth narrative surrounding the Las Vegas economy.[viii],[ix]) By comparison, Red Rock’s peers are much more geographically diverse (Table 3).

Table 3: Geographic Diversification of Gaming Companies

Company

U.S. States with Operations

Red Rock Resorts

1

Eldorado Resorts

10

Boyd Gaming

7

Golden Gaming

3

Pinnacle Entertainment

9

Penn National

16

*Management contracts excluded

Source: SEC filings and company websites

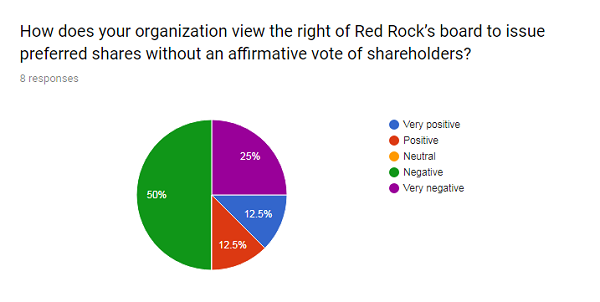
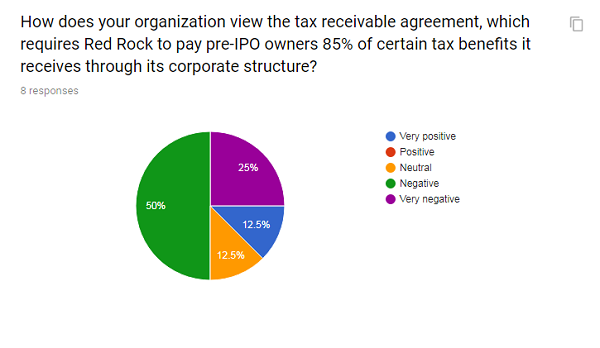
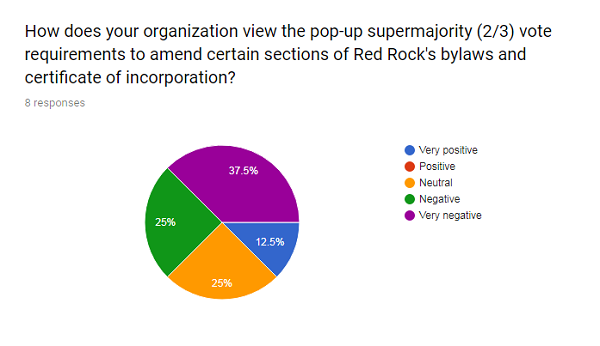
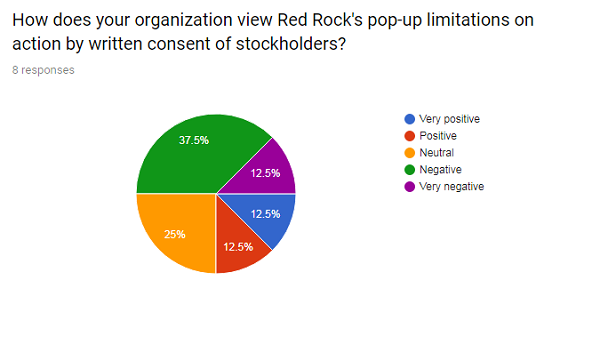
Red Rock is also the only company among its peers to have a dual-class capital structure – providing 10-to-1 super voting stock to the Fertitta insiders – as well as numerous other anti-shareholder provisions that have been the subject of governance alerts by Institutional Shareholder Services and the Council of Institutional Investors. Given the abundance of better performing securities in the gaming space, why did Cohen & Steers bet on Red Rock?

The decision by Cohen & Steers fund managers to invest in Red Rock comes at a time when active managers are facing increased pressure to both outperform their passive counterparts and reduce fees. Nearly $500 billion shifted from active to passive funds in the first half of 2017 and Morgan Stanley estimates that global asset managers’ revenue could drop as much as 30% by 2019.[x],[xi]  According to S&P Dow Jones Indices’ SPIVA® scorecard, actively-managed large-cap, mid-cap, and small-cap funds have underperformed their respective indices over the 1-, 3-, 5-, 10- and 15-year periods (Table 4).[xii]

Table 4: Percentage of U.S. Equity Funds Outperformed by Benchmarks

Fund Category Comparison Index

1-year

3-year 5-year 10-year

15-year

All Large-Cap Funds S&P 500

66.00

93.39 88.30 84.60

92.15

All Mid-Cap Funds S&P MidCap 400

89.37

94.21 89.95 96.03

95.40

All Small-Cap Funds S&P SmallCap 600

85.54

95.69 96.57 95.64

93.21

Source: S&P DJI, SPIVA U.S. Year-End 2016 report


Notes

[i] Larry Swedroe, “Cohen & Steers: The King Of REITs Poised To Provide Investors 42% Annualized Returns,” Seeking Alpha, May 15, 2014, https://seekingalpha.com/article/2218583-cohen-and-steers-the-king-of-reits-poised-to-provide-investors-42-percent-annualized-returns

[ii] Arturo Neto, “Cohen & Steers: King Of REITs Moving In The Right Direction But It Will Take Patience For The Big Payoff,” Seeking Alpha, September 16, 2014. https://seekingalpha.com/article/2497685-cohen-and-steers-king-of-reits-moving-in-the-right-direction-but-it-will-take-patience-for-the-big-payoff

[iii] Cohen & Steers, Inc., “About Us,” website, accessed on October 5, 2017. https://www.cohenandsteers.com/company

[iv] Cohen & Steers, Inc., SEC Form 13F, Information Table, filed on August 14, 2017. https://www.sec.gov/Archives/edgar/data/1284812/000114036117031503/xslForm13F_X01/form13fInfoTable.xml

[v] Cohen & Steers, Inc., SEC Form SC 13G, filed on December 12, 2016.

[vi] Red Rock Resorts, Inc., SEC Form 10-K, filed on March 13, 2017, p. 21.

[vii] Red Rock Resorts, Inc., SEC Form 10-K, filed on March 13, 2017, p. 48.

[viii] Wade Tyler Millward, “Southern Nevada economy still growing, UNLV economist says,” Las Vegas Review-Journal, June 13, 2017, https://www.reviewjournal.com/business/southern-nevada-economy-still-growing-unlv-economist-says/

[ix] Howard Jay Klein, “Boyd Gaming: Has It Expanded Its Locals Market Base At The Expense Of Bigger Possibilities,” Seeking Alpha, September 18, 2017, https://seekingalpha.com/article/4108010-boyd-gaming-expanded-locals-market-base-expense-bigger-possibilities

[x] Charles Stein, “Active vs. Passive Investing,” Bloomberg, July 6, 2017, https://www.bloomberg.com/quicktake/active-vs-passive-investing

[xi] Sarah Jones, “Asset Manager Revenue May Fall 30% by 2019, Morgan Stanley Says,” Bloomberg, March 17, 2017, https://www.bloomberg.com/news/articles/2017-03-17/asset-manager-revenues-could-slump-30-percent-by-2019-ms-says

[xii] S&P DJI, “SPIVA U.S. Year-End 2016,” report, April 12, 2017, p. 8, http://us.spindices.com/search/?ContentType=SPIVA

The Palms Conundrum

What is Station Casinos doing with Palms?

That’s a question that should be on investors’ minds since the company has committed nearly half a billion dollars to the latest addition to its portfolio of casinos in Las Vegas. Adding $146 million of renovation cost to the $312.5-milion purchase price brings the total capex on Palms to $452.5 million. As explained by CFO Stephen Cootey, the company’s “expected returns” on “any capital expenditures” are in the “mid to low teens” range. This would suggest that, in a best-case scenario, investors might see Palms’ making annual EBITDA of close to $70 million (425.5 x 15% = 67.9) after the renovation is done by the end of second quarter next year. This is a much more ambitious target than the $35 million the company originally put forth when it announced the acquisition. (We raised some questions about that projection previously, given our estimate that Palms’ LTM EBITDA was approximately $28 million at the time.) So how will Station Casinos get there?

Palms is not a typical Station Casinos property

A major challenge facing Station Casinos is the fact that Palms is a very different kind of property from what the company is used to operating. Even though Palms was described as a “leading gaming asset” by Station management, it did not generate most of its revenues from gaming. In fact, the casino department contributed only approximately 37% of its property-level gross revenue during the fourth quarter of last year, according to Red Rock Resorts’ 10-K. Even assuming there was some disruption due to the change in ownership and management, that figure shows Palms is a very different breed of casino resort than other Station properties.

(In $ millions) 4Q16 % of Total
Casino revenues (reported) 15.5 37.0%
F&B revenues (reported) 8.7 20.8%
Rooms revenues (reported) 11.6 27.7%
Other revenues (estimated) 6.0 14.5%
Gross revenues (estimated)* 41.8

* Red Rock reported the net revenues were $38.5 million at Palms in 4Q16. Assuming promotional allowances of 8% of gross revenues, we calculated the gross revenues to be $41.8 million.

In fact, Palms seems to be very similar to a Strip resort in terms of its revenue mix. Here’s the revenue breakdown of major Strip properties last year, according to the most recent Nevada Gaming Abstract.

(in $ millions) FY2016 % of Total
Casino 5,396 34.1%
Rooms 4,419 28.0%
Food 2,527 16.0%
Beverage 1,126 7.1%
Other 2,335 14.8%
Total 15,805

This is not how Station Casinos has run its business. Before Palms, Station Casinos properties had always generated most of their revenues from the casino floor. Back in 2006, gaming made up anywhere from just under two thirds to over 80% of gross revenues at the company’s “large properties” in Las Vegas (according to a report filed during the Station Casinos Chapter 11 case).

(In $ millions) Gross Revenues Gaming Revenues Gaming as % of Gross
Palace Station 176.1 126.0 71.6%
Boulder Station 216.9 174.7 80.5%
Texas Station 143.3 107.9 75.3%
Sunset Station 222.9 168.0 75.4%
Santa Fe Station 184.1 150.3 81.6%
Green Valley 297.9 202.9 68.1%
Fiesta Rancho 73.2 58.0 79.3%
Fiesta Henderson 83.9 61.0 72.7%
Red Rock (Opened 4/18/06) 250.3 158.8 63.4%
Total 1,648.6 1,207.6 73.2%

This heavy reliance on gaming was true of even Green Valley Ranch (which had been open for five years) and Red Rock Station (which had been open for less than a year). It is true that these “hybrid” properties, which according to the company “appeal to both Las Vegas residents and tourists”, have a greater non-gaming side to their operations, but they still seem to be very different than Palms.

And we do not believe the revenue mix has changed significantly at GVR and Red Rock, since the most recent pre-Palms financial disclosures continued to show the overweighting of casino revenue in its Las Vegas properties. In the first nine months of 2016, Station Casinos earned approximately 67% of its gross revenues from gaming at its Las Vegas properties (i.e., company-wide gross revenues excluding management fees revenues).

(In $ millions) 9M16 % of Gross
Casino revenues 706.2 67.0%
F&B revenues 196.6 18.6%
Rooms revenues 99.6 9.4%
Other revenues 52.4 5.0%
Gross revenues 1,054.6

What kind of management experience can a company like this bring to Palms? Does Station Casinos have the management know-how to operate an almost-Strip property like Palms?

Will casino revenue at a “Stationized” Palms go from one-third of total revenue to two-thirds of the total? If that is indeed the goal, then presumably the strategy is to grow gaming revenue at Palms and not to shrink the non-gaming business there. How would then Station Casinos go about doing that?

Management instability

Whatever the strategy there is for growing revenue (and EBITDA) at Palms, why is Station Casinos already onto its third general manager at the property in less than a year’s time?

When Stations Casinos officially took over last year, Michael Jerlecki, formerly the general manager of Palace Station, which is not one of the company’s “luxury” properties, was made the new Palms general manager. By January 2017, Jerlecki was quietly replaced by Anthony Faranca (according to Faranca’s LinkedIn page), who had been general manager of the Parx racino outside Philadelphia, a change the company didn’t officially announced until April. Then, in July a local magazine profiled new Palms executive Jon Gray and described him as the property’s general manager, in spite of any formal announcement from the company. (Gray did sign as the general manager letters informing workers of their termination due to the closing of several F&B venues at Palms in early September.)

The hiring of Gray was something of a homecoming, for he was an executive at the Palms when it was still owned by the Maloofs and was general manager of N9Ne Group heading up the hotel’s nightclubs, restaurants, and pool events at the property. He also opened the non-gaming F&B/entertainment LINQ District on the Strip and worked for Nike in Oregon before returning to Palms. What is missing from this impressive resume, though, is any significant experience with casino operations.

Assuming he lasts longer than his two predecessors as Palms’ general manager, is Jon Gray the right person to “Stationize” and grow casino revenue at Palms?

Law Firms Announce Investigations into Red Rock Resorts

Six law firms have announced investigations into Red Rock Resorts following the company’s annual meeting in July, when shareholders showed their dissatisfaction with the company’s directors.

1. Harwood Feffer LP
“Our investigation concerns whether the Company board of directors has breached its fiduciary duties to shareholders, grossly mismanaged the Company, and/or committed abuses of control in connection with potential self-dealing and related party transactions.”
Read the press release: http://www.prnewswire.com/news-releases/harwood-feffer-llp-announces-investigation-of-red-rock-resorts-inc-300489300.html

2. Andrew & Springer LLC
“Andrews & Springer LLC, a boutique securities class action law firm focused on representing shareholders nationwide, is investigating potential securities violation claims and breach of fiduciary duty claims against Red Rock Resorts, Inc.”
Read the press release: http://www.businesswire.com/news/home/20170717005016/en/

3. Levi & Korsinsky, LLP
“Levi & Korsinsky announces it has commenced an investigation of Red Rock Resorts, Inc. (NASDAQ:RRR) concerning possible breaches of fiduciary duty.”
Read the press release: http://www.businesswire.com/news/home/20170717006253/en/

4. Glancy Prongay & Murray LLP
“The investigation concerns whether the Company board of directors has breached its fiduciary duties to shareholders, grossly mismanaged the Company, and/or committed abuses of control in connection with potential self-dealing and related party transactions, including allegedly overpaying for Red Rock real estate.”
Read 1st press release: http://www.businesswire.com/news/home/20170718006073/en/
Read 2nd press release: http://www.businesswire.com/news/home/20170822006124/en/

5. Lifshitz & Miller LLP
“Lifshitz & Miller announces investigation on behalf of RRR investors concerning whether RRR’s board breached its fiduciary duties and engaged in self-dealing transactions, including allegedly overpaying for RRR real estate.”
Read the press release: http://www.prnewswire.com/news-releases/lifshitz–miller-llp-announces-investigation-of-blue-apron-holdings-inc-irobot-corporation-monogram-residential-trust-inc-quadrant-4-system-corporation-red-rock-resorts-inc-west-marine-inc-and-zto-express-cayman-in-300492913.html

6. Kahn Swick & Foti, LLC
“KSF’s investigation is focusing on whether Red Rock Resorts’ officers and/or directors breached their fiduciary duties to the Company’s shareholders or otherwise violated state or federal laws.”
Read 1st press release: http://www.businesswire.com/news/home/20170728005837/en/
Read 2nd press release: http://www.businesswire.com/news/home/20170811005623/en/

An Update on Private Jets (and Yachts!)

The Fertitta Fleet

Readers may recall that Fertitta Entertainment LLC, the Fertitta-owned company that had no business other than managing Fertitta-owned-Station Casinos’ properties under contract, was purchased by Fertitta-controlled Red Rock Resorts last year using IPO proceeds plus additional debt. One of the interesting features of the transaction was that the private jet of Fertitta Entertainment was not included in the deal. The $30-million airplane was instead “transferred” to Fertitta Business Management LLC, making the Fertittas collectively owners of four private jets.

No More Private Jets for Red Rock: Of the planes owned by Fertitta entities, a Boeing Business Jet and a Gulfstream G-IV have been on the market since at least February 9, 2017.  The remaining jets not for sale are the 2011 Bombardier Global Express from Fertitta Entertainment and a 2008 Bombardier Global Express.

Even with their own private jets, sometimes the Fertittas would make use of the company jet for their own personal travel. In 2016, Red Rock’s CEO made $41,495 worth of personal use of the Fertitta Entertainment jet, up to the point of the consummation of the IPO, when the plane’s ownership transferred. In 2015 and 2014, the CEO compensation included $246,486 and $187,146 for “personal use of aircraft leased by Fertitta Entertainment,” respectively.[1] Before Station Casinos, Inc. filed for Chapter 11 bankruptcy, executives also made “personal use” of the company’s airplane. In 2006, for example, compensation for three executives included $147,765 of personal use of company aircraft.[2]

That’s a lot of personal travel on these executives’ part. But presumably the company (Red Rock and its pre-Chapter 11 predecessor Station Casinos Inc.) had a company jet for business purposes. Now that Red Rock Resorts is private jet-free, do its executives simply fly commercial as they try to look for growth opportunities outside Las Vegas, even around the world (e.g., Brazil)? Are they looking for growth opportunities?

The Fertittas’ private fleet made 153 flights into airports in southern California in the twelve months following RRR’s IPO. In the same period, international destinations included locations in southern Europe and the Caribbean (but no flights to Brazil).

From Private Jets to Mega-Yachts: While preparing to take their company public, the Fertittas financed the construction of two mega-yachts. Financing for a 285-foot yacht was secured on November 2, 2015, and for a 308-foot yacht on March 24, 2016. Photos of just one of the yachts have surfaced online.

Should billionaire owners of such super yachts continue to be subsidized by Red Rock Resorts outside shareholders, who have been paying the Fertittas’ income tax with cash “tax distributions”?

In 2016, cash distributions to owners of Station Casino LLC totaled $142.8 million, including $43.6 million of “tax distributions.” In 2015, cash distributions to owner of Station Casinos LLC totaled $162.3 million [3], but the amount of tax distributions was not disclosed.


* Based on capacity of yachts of similar length

[1] See Red Rock Resorts Inc., SEC Form 424B1, filed 4/28/16, p. 138; and Station Casinos LLC, SEC Form 10-K, filed 3/10/15, p. 112.
[2] Station Casinos Inc., SEC Form 10-K/A. filed 4/27/07, p. 16.
[3] Station Casinos LLC, SEC Form 10-K, filed 2/29/16, p. 81

Outside Shareholders Dissent at Red Rock Resorts’ Annual Meeting

Outside shareholders of Red Rock Resorts demonstrated their dissatisfaction with the company’s directors at its July 6th meeting of stockholders, with the most opposition shown toward the independent directors.

Assuming all insiders voted their Class A and Class B shares in favor of management’s recommendation, then the total outside Class A shareholder vote “for” the directors was between 59% and 71%.[i] That means between 29% and 41% of outside shareholders did not vote “for” the company’s directors

Outside Class A Shareholder Support for Red Rock’s Directors

Director Outside Class A “For” Outside Class A “For” %
Frank J. Fertitta III 47,606,865 71%
Lorenzo Fertitta 46,912,406 70%
James E. Nave 40,389,581 60%
Robert E. Lewis 40,425,855 60%
Robert A. Cashell, Jr. 39,415,189 59%


Ernst & Young reports
that only 3.8% of Russell 3000 directors received less than 80% support from all shareholders (combined inside and outside) in 2017 (YTD, 5/31/2017). Therefore, a significant number of Red Rock’s outside shareholders expressed discontent with the entire board.

Alternatively, we can look directly at the “withhold” vote. Commenting on a 2012 study commissioned by the Investor Responsibility Research Center Institute, GMI’s Ratings director of research Kimberly Gladman said: “The average level of withheld votes in a director’s election is 5 percent; companies should be concerned when the level in an election exceeds 10 percent.”

To measure shareholder dissatisfaction this way at the recent Red Rock meeting, we reduce the super voting shares held by insiders to a one share, one vote standard. This adjusted votes figure more accurately reflects the desires of all equity holders, not just the Fertitta insiders. If all shareholders of Red Rock had equal voting rights and assuming no Class B shareholders withheld their votes, then the vote results show between 9% and 16% of shareholders withheld from the company’s directors.

Adjusted Votes Withheld from Red Rock’s Directors

Director Adjusted Votes Withheld Adjusted Votes Withheld %
Frank J. Fertitta III 10,593,246 9%
Lorenzo Fertitta 11,287,705 10%
James E. Nave 17,810,530 15%
Robert E. Lewis 17,774,256 15%
Robert A. Cashell, Jr. 18,784,922 16%

Red Rock’s closing share price on July 5th (the day before the annual meeting) was down 3.1% year-to-date compared with NASDAQ Composite Index’s gain of 13.3%. As of May 8th, Class A shareholders held 58.4% of the equity but only controlled 12.9% of the vote.[ii]

Read the letter and report we sent to Red Rock’s public investors, criticizing the company’s independent directors for anti-shareholder corporate governance measures and related-party transactions and encouraging investors to withhold votes from its independent directors.

ISS recommended withholding on all of the company’s directors, which we fully supported.

See table below for how we calculated inside, outside, and adjusted votes.

Inside and Outside Votes

Share Class Number of Shares Votes
Class A Shares Outstanding 67,778,152 67,778,152
Insider Class A Shares 516,326 516,326
Outside Class A Shares 67,261,826 67,261,826
Class B Shares Outstanding 48,327,396 456,799,632
Insider Class B Shares (1 vote per share) 2,941,592 2,941,592
Insider Class B Shares (10 votes per share) 45,385,804 453,858,040
Class A + B Outstanding 116,105,548 524,577,784
*Number of adjusted votes equals the number of Class A + B outstanding

[i] At the July 6th annual meeting, Richard Haskins, President of Red Rock Resorts, said as of record date (May 8, 2017) there were 67,778,152 Class A shares outstanding, 48,327,396 Class B shares outstanding, and 45,385,804 Class B shares with 10 votes per share. These figures were used to calculate the number of Class B shares with one vote per share, the voting power and equity of each class, and to estimate the number of insider and outsider “for” votes. The number of insider Class A shares comes from Red Rock’s DEFR14A, filed on May 26, 2017, p. 47.

[ii] See note i

Why It Is Necessary to Withhold Your Vote

In a new report we argue that it is necessary for Red Rock Resorts’ shareholders to withhold votes from the company’s three independent directors – James E. Nave, D.V.M., Robert E. Lewis, and Robert A. Cashell, Jr. – on their proxies for the company’s July 6, 2017 annual stockholders meeting.

Read our report encouraging shareholders to withhold votes on Red Rock’s independent directors.

We fully support ISS’ recommendation to withhold votes on all of Red Rock’s directors.

These long-serving directors have failed to advocate for the sunsetting of the company’s myriad of poor corporate governance features since its IPO last year, and they have not acted to prevent the enrichment of company insiders and related parties. We believe it is essential to send an unambiguous message to management that investors expect a higher standard of corporate governance at a publicly-traded company, especially now that outside shareholders own a majority of the economic interest in the company.

In taking the company public, Red Rock’s board of directors implemented several antitakeover measures, including a dual-class ownership structure with 10:1 super voting stock for insiders.

Red Rock’s three independent directors are the sole members of its Nominating and Corporate Governance Committee, which is responsible for monitoring the company’s governance matters. Furthermore, Red Rock’s independent directors have a history of approving transactions that are not in the best interest of the company or its outside shareholders.

For these reasons, we encourage Red Rock’s Class A shareholders to withhold their votes from the elections from Directors Nave, Lewis, and Cashell at the company’s upcoming annual meeting of stockholders.