Posts

Questions about “Durango Station”

Back in 2007, Station Casinos received approvals from Clark County to build a 120,000-square-foot casino with 1,000 hotel rooms on its 71-acre property in southwest Las Vegas. The project had a $700 million budget and was to open in 2010 with a projected EBITDA of $110.1 million by 2012.[1] Then in 2008, the company reduced the size of the project, with new approvals for an 86,883-square-foot casino with 726 hotel rooms, plus 8 retail buildings totaling 139,071 square feet. The company received a fourth extension of time for this project in October, 2018, with a deadline to commence by September 3 this year.[2] On May 4, the company said it was looking to redesign the project to be “significantly tighter than anything that we’ve done in the past”, with “a focus on slot machines and table games, our primary business.”[3]

We believe investors should pose the following questions about the “Durango Station” project to management:

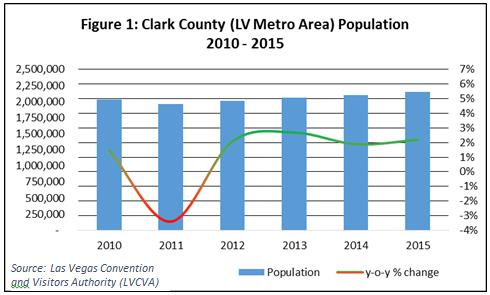
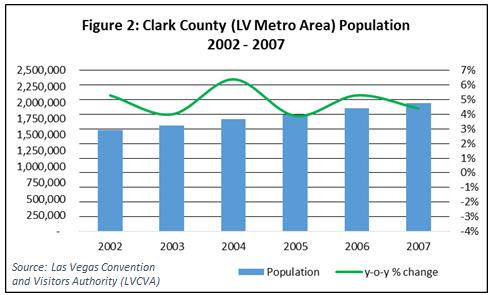
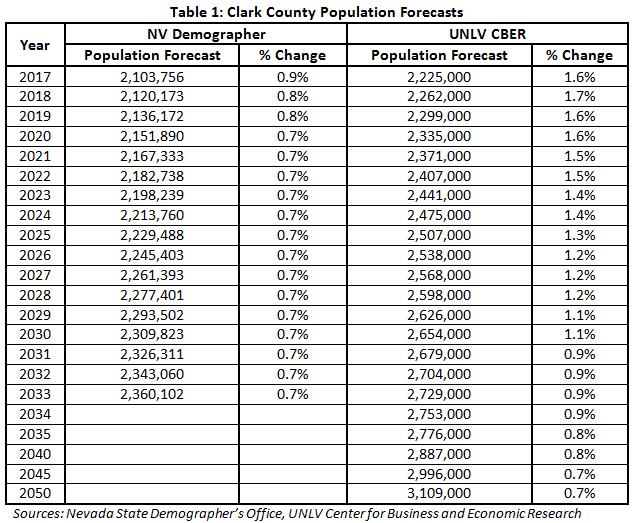
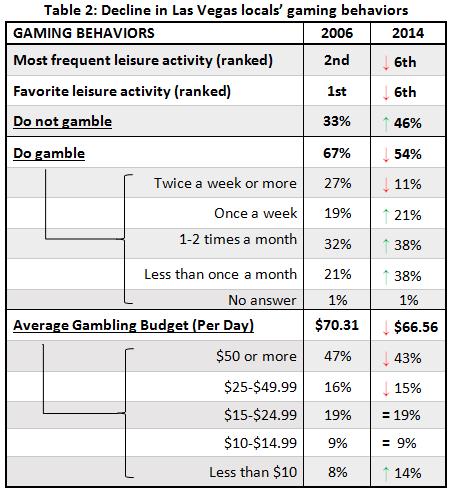
  1. Is there market demand for another Las Vegas Locals casino? While total slot handle in the Las Vegas Locals market reached a record of $41.1 billion in 2006, it had dropped to $35.1 billion in 2019. This happened in spite of the fact that Clark County’s population grew from 1.78 million in 2006 to 2.29 million in 2019.[4] Corresponding to this decline in local residents’ spending on slot machines, the number of slot machines in the market had been reduced from 52,947 at the end of 2006 to 44,696 at the end of 2019 and stood at 34,799 at the end of May, 2021. Station Casinos itself has yet to reopen four of its ten major properties after Nevada casinos were allowed to reopen more than a year ago (and is in fact selling one of them, the Palms). Will Durango Station be able to grow the Las Vegas Locals market given the long-term market-wide decline in slot handle?
  2. How many “Durango Station” customers will come from Red Rock Casino? Looking specifically at the area around the Durango site, we see that Station Casinos’ Red Rock Casino is 9 miles north. The 10-minute drive from the neighborhood around the Durango site to Red Rock is not a long distance to travel in Las Vegas. Given its player rewards program, the company likely has detailed data on where its regular Red Rock customers live. How many “Durango Station” customers then does management expect to be new customers instead of customer who will merely shift their business from Red Rock to the new property?
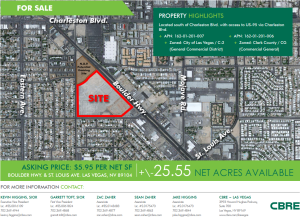
  3. How will “Durango Station” compete against nearby mixed-use developments? Again, looking at the Durango site, we see that, across the street from the Durango site, construction has already started on the $400-million UnCommons mixed-use project,[5] which is slated to open in early 2022,[6] at about the same time Station Casinos plans to start its own project.[7] UnCommons will have 20 vendors in a food hall, [8] including a celebrity chef’s new restaurant.[9] Less than a mile north of the Durango Station site, another mixed-use development called The Bend also broke ground in January, 2020, which will have 170,000 square feet of retail space, including a movie theater.[10] How will these large mixed-use projects nearby change the economics of the Durango Station project?
  4. What will happen to the Flamingo/I-215 site after “Durango Station”? One of Station Casinos’ future casino development sites in Las Vegas is the 58-acre Flamingo/I-215 parcel, which is located about halfway between Red Rock and the Durango site. After “Durango Station” opens, will the Flamingo site continue to be considered a future casino development site, or will the company seek to monetize some other way?

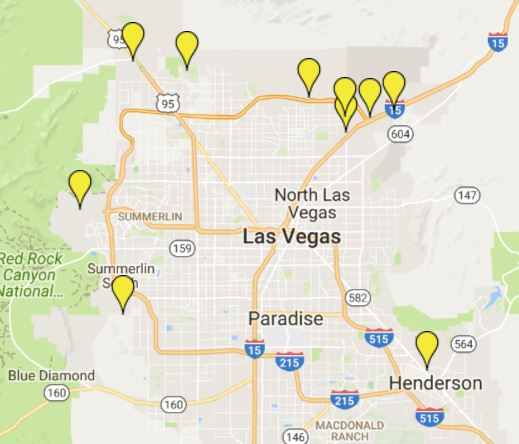
Check out our map of key properties and sites in the Las Vegas Locals market here.

Notes:

[1] See “Report of Investigation by the Special Litigation Committee of the Board of Directors of Station Casinos, Inc.”, filed as docket 353-3 in the Chapter 11 case of Station Casinos, Inc., case 09-52477-gwz in the U.S. Bankruptcy Court, District of Nevada. The merger proxy contains the project cost, and the attached Odyssey Capital Group’s Report to the Special Committee to the Board of Directors of Station Casinos, Inc., September 9, 2009 shows the projected EBITDA in “Valuation of short-term Development Assets” (by Bear Stearns Presentation to Station Casinos Special Committee on February 22, 2007).

[2] 10/17/2018 Clark County Zoning Commission meeting, agenda item #25, ET-18-400190 (UC-0726-08) by NP Durango, LLC. http://clark.granicus.com/MinutesViewer.php?view_id=17&clip_id=6025.

[3] Red Rock Resorts 1Q21 quarterly call on 5/4/2021, transcript by Seeking Alpha.

[4] Based on Nevada Gaming Control Board data.

[5] https://www.reviewjournal.com/business/developer-of-400m-las-vegas-complex-lands-new-tenant-2404247/

[6] https://www.naiop.org/Research-and-Publications/Magazine/2021/Summer-2021/Development-Ownership/New-Noteworthy

[7] Red Rock Resorts 1Q21 quarterly call on 5/4/2021, transcript by Seeking Alpha.

[8] https://www.reviewjournal.com/business/400m-development-project-taking-shape-in-southwest-las-vegas-2317761/

[9] https://www.reviewjournal.com/entertainment/food/celebrity-chef-michael-mina-to-head-off-strip-at-uncommons-2375335/

[10] https://www.reviewjournal.com/local/local-las-vegas/work-begins-on-the-bend-retail-complex-in-southwest-las-vegas-1947323/

Opportunity Cost: The Case of Cohen & Steers’ Investment in Red Rock Resorts

Cohen & Steers, Inc. (NYSE: CNS) filed a Schedule 13G on December 12, 2016, announcing its beneficial ownership (at the time 15.94% of Class A shares) in Red Rock Resorts. This was an interesting move by Cohen & Steers, which is often praised as the “king of REITs”[i],[ii] and self-described as “pioneers in REIT investing.”[iii] The company has no other investments in the gaming industry besides the REIT Gaming and Leisure Properties.[iv] However, since Red Rock is not a REIT and has not announced any plans to convert its assets into a REIT, why did CNS take such a large stake in Red Rock and continue to hold on to it? Red Rock’s stock (the publicly-traded Class A shares) has struggled year-to-date compared to the market and its regional gaming peers. CNS investors should ask how long the firm is willing to wait for its bet on Red Rock to pay off.

Red Rock’s share price has underperformed the markets year-to-date. As of the closing prices on September 29, 2017, the NASDAQ composite index is up 19.7%, the S&P 500 is up 11.9%, and the Russell 2000 is up 9.8%, while Red Rock’s share price has declined by 0.86%. On the other hand, Red Rock’s peers have significantly outperformed the markets year-to-date (Table 1).

Table 1: Share Price % Change YTD (through 9/29/17)

Company or Index

Share price (1/3/17, open)

Share price (9/29/2017, close)

Year-to-date % change

Red Rock Resorts

$23.36

$23.16

-0.86%

Eldorado Resorts

$17.10

$25.65

50.0%

Boyd Gaming

$20.40

$26.05

27.7%

Golden Entertainment

$12.24

$24.38

99.2%

Pinnacle Entertainment

$14.65

$21.31

45.5%

Penn National

$13.90

$23.39

68.3%

Gaming and Leisure Prop (REIT)

$30.77

$36.89

19.9%

MGM Growth Properties (REIT)

$25.31

$30.21

19.4%

NASDAQ composite index

$5,425.62

$6,495.96

19.7%

Dow Jones Industrial Average

$19,872.86

$22,405.03

12.7%

S&P 500

$2,251.57

$2,519.36

11.9%

Russell 2000

$1,357.99

$1490.86

9.78%

Source: Yahoo Finance

Cohen & Steers’ 13G filed on December 12, 2016, shows the company owned 9,739,009 of Red Rock’s Class A shares. At the start of 2017, the value of these shares was approximately $228 million.[v] Red Rock’s share price has not appreciated year-to-date (through 3Q17). If Cohen & Steers had put this $228 million investment in nearly any other gaming company, including the two actual gaming REITs, it would have generated sizable returns for its investors and clients (Table 2). Holding onto Red Rock’s Class A shares had a significant opportunity cost for Cohen & Steers.

Table 2: Market Appreciation and Opportunity Cost YTD (through 9/29/17)

Company

Share Price
YTD % change (9/29/17)

Potential Value
(9/29/17)

Opportunity Costs

Eldorado Resorts

50.0%

$342 mm

$116 mm

Boyd Gaming

27.7%

$291 mm

$65 mm

Golden Entertainment

99.2%

$454 mm

$228 mm

Pinnacle Entertainment

45.5%

$332 mm

$106 mm

Penn National

68.3%

$384 mm

$158 mm

Gaming and Leisure Prop (REIT)

19.9%

$273 mm

$47 mm

MGM Growth Properties (REIT)

19.4%

$272 mm

$46 mm

Red Rock’s investment risks are very clear, such as its limited geography diversity, dependence on Las Vegas macro fundamentals, and its long-held but vacant land holdings with few shovel-ready development plans. In its S-1 filed on October 26, 2016, Red Rock states:

We depend on the Las Vegas locals and repeat visitor markets as our key markets, which subjects us to greater risks than a gaming company with more diverse operations.

Except for fees from its set-to-expire management contracts at Gun Lake and Graton ($111 million in 2016)[vi], Red Rock relies on the Las Vegas valley for all of its revenues. In 2016, 92% of the company’s consolidated net revenues were from its Las Vegas operations.[vii] This should be a red flag for investors skeptical about the Las Vegas locals market recovery. (A notable economist and gaming analyst recently cast doubt on the strong growth narrative surrounding the Las Vegas economy.[viii],[ix]) By comparison, Red Rock’s peers are much more geographically diverse (Table 3).

Table 3: Geographic Diversification of Gaming Companies

Company

U.S. States with Operations

Red Rock Resorts

1

Eldorado Resorts

10

Boyd Gaming

7

Golden Gaming

3

Pinnacle Entertainment

9

Penn National

16

*Management contracts excluded

Source: SEC filings and company websites

Red Rock is also the only company among its peers to have a dual-class capital structure – providing 10-to-1 super voting stock to the Fertitta insiders – as well as numerous other anti-shareholder provisions that have been the subject of governance alerts by Institutional Shareholder Services and the Council of Institutional Investors. Given the abundance of better performing securities in the gaming space, why did Cohen & Steers bet on Red Rock?

The decision by Cohen & Steers fund managers to invest in Red Rock comes at a time when active managers are facing increased pressure to both outperform their passive counterparts and reduce fees. Nearly $500 billion shifted from active to passive funds in the first half of 2017 and Morgan Stanley estimates that global asset managers’ revenue could drop as much as 30% by 2019.[x],[xi]  According to S&P Dow Jones Indices’ SPIVA® scorecard, actively-managed large-cap, mid-cap, and small-cap funds have underperformed their respective indices over the 1-, 3-, 5-, 10- and 15-year periods (Table 4).[xii]

Table 4: Percentage of U.S. Equity Funds Outperformed by Benchmarks

Fund Category Comparison Index

1-year

3-year 5-year 10-year

15-year

All Large-Cap Funds S&P 500

66.00

93.39 88.30 84.60

92.15

All Mid-Cap Funds S&P MidCap 400

89.37

94.21 89.95 96.03

95.40

All Small-Cap Funds S&P SmallCap 600

85.54

95.69 96.57 95.64

93.21

Source: S&P DJI, SPIVA U.S. Year-End 2016 report


Notes

[i] Larry Swedroe, “Cohen & Steers: The King Of REITs Poised To Provide Investors 42% Annualized Returns,” Seeking Alpha, May 15, 2014, https://seekingalpha.com/article/2218583-cohen-and-steers-the-king-of-reits-poised-to-provide-investors-42-percent-annualized-returns

[ii] Arturo Neto, “Cohen & Steers: King Of REITs Moving In The Right Direction But It Will Take Patience For The Big Payoff,” Seeking Alpha, September 16, 2014. https://seekingalpha.com/article/2497685-cohen-and-steers-king-of-reits-moving-in-the-right-direction-but-it-will-take-patience-for-the-big-payoff

[iii] Cohen & Steers, Inc., “About Us,” website, accessed on October 5, 2017. https://www.cohenandsteers.com/company

[iv] Cohen & Steers, Inc., SEC Form 13F, Information Table, filed on August 14, 2017. https://www.sec.gov/Archives/edgar/data/1284812/000114036117031503/xslForm13F_X01/form13fInfoTable.xml

[v] Cohen & Steers, Inc., SEC Form SC 13G, filed on December 12, 2016.

[vi] Red Rock Resorts, Inc., SEC Form 10-K, filed on March 13, 2017, p. 21.

[vii] Red Rock Resorts, Inc., SEC Form 10-K, filed on March 13, 2017, p. 48.

[viii] Wade Tyler Millward, “Southern Nevada economy still growing, UNLV economist says,” Las Vegas Review-Journal, June 13, 2017, https://www.reviewjournal.com/business/southern-nevada-economy-still-growing-unlv-economist-says/

[ix] Howard Jay Klein, “Boyd Gaming: Has It Expanded Its Locals Market Base At The Expense Of Bigger Possibilities,” Seeking Alpha, September 18, 2017, https://seekingalpha.com/article/4108010-boyd-gaming-expanded-locals-market-base-expense-bigger-possibilities

[x] Charles Stein, “Active vs. Passive Investing,” Bloomberg, July 6, 2017, https://www.bloomberg.com/quicktake/active-vs-passive-investing

[xi] Sarah Jones, “Asset Manager Revenue May Fall 30% by 2019, Morgan Stanley Says,” Bloomberg, March 17, 2017, https://www.bloomberg.com/news/articles/2017-03-17/asset-manager-revenues-could-slump-30-percent-by-2019-ms-says

[xii] S&P DJI, “SPIVA U.S. Year-End 2016,” report, April 12, 2017, p. 8, http://us.spindices.com/search/?ContentType=SPIVA

The Myth of the Las Vegas Locals Market Recovery

Red Rock Resorts is heavily dependent on the health of the Las Vegas locals gaming market. In this report, we examine key gaming metrics in the Las Vegas locals market – going beyond simple measures of gaming revenue – in order to gauge the company’s potential to grow back up to the peak levels of 2007.

We challenge the myth that growth in the Las Vegas locals market will lead to recovery of the 2007 heights anytime soon. As we focus on slot handle and slot payout trends, we find there is little increase in slot handle while higher gaming revenue has come from tighter slots.

What we see is that the slot handle has been increasing at a slow pace in the Las Vegas locals market. From January 2012 to January 2017, slot handle in the locals market increased by only 1.88% with a CAGR of 0.37%. These monthly handle numbers show a relatively stagnant market with little growth.

In contrast, the monthly handle numbers leading up to the Las Vegas locals market’s historic peak in 2007 paint a very different picture. From January 2002 to January 2007, monthly handle increased by 33.8% with a CAGR of 5.99%.  As of March 2017, total slot handle in the Las Vegas locals market was down 20.6% from its historic peak in March 2007.

Las Vegas Locals Market Handle Increase CAGR
Run up to peak (Jan 2002 – Jan 2007) 33.8% 5.99%
Current (Jan 2012 – Jan 2017) 1.88% 0.37%

Our analysis of historical slot handle and win percent numbers for the Las Vegas locals market shows that one reason for the increases in gaming revenue in the Las Vegas locals market (and the myth about the locals market recovery), is tighter slot machines. Investors should ask management when Red Rock will be able to grow to pre-recession levels of business in this stagnant and saturated Las Vegas locals market.

Read Part I: How Will Red Rock Grow in a Saturated and Stagnant Market?

Read Part II: The Myth of the Las Vegas Locals Market Recovery 


(Picture source: https://commons.wikimedia.org/wiki/File:Sandro_Botticelli_021.jpg)

Why is Red Rock Resorts’ Share Price Underperforming the Market and Its Peers?

Why is Red Rock Resorts’ Share Price Underperforming the Market and Its Peers?

In the first quarter of 2017, Red Rock Resorts’ Class A share price declined by 7% while the S&P 500 index went up by 4.65%.

rrrvsp500-1q17

(Source: Yahoo Finance)

RRR’s share price dropped while other regional gaming operators’ share prices rose in the quarter:

rrrvregionals-1q17

(Source: Yahoo Finance)

What explains this significant underperformance of RRR stock? We believe investors are likely concerned with the Palms acquisition and the uncertainty in the company’s growth pipeline:

Is the Palms acquisition meeting management expectation?

When the $316-million Palms acquisition was first announced last May, the company said that “[f]actoring in anticipated synergies, the Company estimates that the Palms will generate $35 million in EBITDA during the Company’s first full year of ownership.” Is the company on track to meet this goal?

When Station Casinos officially took ownership of the Palms on Oct. 1, Michael Jerlecki, who had been the general manager of Palace Station, became the resort’s GM. However, Jerlecki was replaced by Anthony Faranca by early February without any public announcement from the company. (The new GM is mentioned in passing in a local columnist’s write-up on new assistant manager Jon Gray.) We do know from the company’s recently filed 10-K that Palms had a net pretax loss of $1.3 million in the fourth quarter on net revenues of $38.5 million.

Given these numbers, investors might wonder whether the Palms is on track to make $35 million in EBITDA through September 30 this year. While the company did not provide property-level breakout of Palms’ EBITDA for the fourth quarter, investors should demand greater clarity going forward so they can better understand whether the expensive, debt-financed purchase is paying off as management had anticipated.

What happened to the Palms Place hotel rooms?

The company’s 10-K shows there were 713 hotel rooms at the Palms, but makes no mention of the condo-hotel units at Palms Place. Back in September, the company’s investor presentation showed that, at Palms, in addition to 713 rooms across two hotel towers, there were “approximately 448” condo units at the stand-alone Palms Place tower in the “room rental program, pursuant to which the Company receives 50% of the room rate and 100% of the resort fee on any such rentals.”

What happened to these 448 hotel units at Palms Place? They would account for about 39% of total available hotel units at the company’s new acquisition. The 10-K does not say anything about this Palms Place condo-hotel program. Has the company decided not to manage Palms Place’s hotel pool anymore? If so, how might that affect the goal of making $35 million in EBITDA at the Palms through September 30?

Why is no one adding significant capacity in the Las Vegas locals market?

We recently took a closer look at the company’s new development pipeline in Las Vegas and found little that was “shovel ready.” Given the lack of discussion on this issue during the analyst call, we believe some further questions are warranted.

For example, when will the company tell investors more about the planned second hotel tower at Palace Station, which received planning approval in September? The planned tower is absent from the discussion of the on-going $115-million “upgrade” of Palace Station in the company’s latest investor presentation from March 20.

While the company continues to tout its “Existing Development Sites” in Las Vegas such as “Durango” and “Viva” in its March presentation, it has not announced any concrete plans to build out those sites. Moreover, there are ten “Gaming Enterprise Districts” in the Las Vegas Valley which are not owned or controlled by Station Casinos.

non-rrr_geds

(See our interactive map of casinos and casino sites in the Las Vegas locals market.)

The existence of these non-Station future casino sites should make investors skeptical of any claims of barriers of entry to the Las Vegas locals market. Moreover, if the Las Vegas locals market is growing significantly, why have these other developers not seen fit to build out new Las Vegas locals casinos?

What will happen in the company’s tribal casino management segment in 2021?

Outside of Las Vegas, there are looming challenges in the company’s tribal casino segment. Its two existing management agreements expire in February, 2018, and November, 2020, respectively. The company estimates that its only other tribal casino project will require another 36 to 48 months to begin construction and 18 months after construction begins to complete and open.

This means the earliest opening date would fall around September, 2021, and that the company most likely will not have a tribal casino management fee revenue stream in 2021. To be clear, the tribal casino management segment accounted for 7.6% of the company’s net revenues and 18.0% of adjusted EBITDA in 2016.

It should be noted that the company’s $225-million Term Loan A and $685-million Term Loan B both mature in June 2021, and its $500 million of 7.5% senior notes are due March 1, 2021. That is a total of approximately $1.4 billion of debt coming due when the company will likely not have any tribal casino management revenue. Will the company be able to roll over that debt given this potential lack of tribal casino management revenue in 2021?

Fallow Land, Hollow Claims

Red Rock Resorts has been talking up its Las Vegas development sites and master-planned expansions in its presentations to investors and SEC filings. However, after a review of local real estate listings and planning agency documents, we found development sites for sale and no approvals on file for some of the company’s master-planned expansions. We present our findings in a new report that you can download here.

Our report on Red Rock’s Las Vegas growth pipeline raises some important questions for investors:

  • Why does the company continue to describe the Cactus and Castaways parcels as “development sites” when they are listed for sale?
  • After over a decade of delays, what is the timeline to build out the Durango development site?
  • Does the company still see value in developing a resort hotel on the Flamingo site, which lies between Red Rock Casino and the Durango site?
  • When will the conditions of Inspirada’s master-planned community improve enough to warrant building a resort hotel?
  • When will the company submit plans for the new hotel tower and meeting space at Red Rock Resort or the meeting space expansion at Sunset Station?

See our report for more information from our review into RRR’s development sites and master-planned expansions.

Check out our map of existing properties and future casino development sites in Las Vegas, including those not controlled by RRR.

How Will Red Rock Grow in a Saturated and Stagnant Market?

In its IPO prospectus, Red Rock Resorts (NASDAQ: RRR) told investors two important pieces of information about its Las Vegas business:

  1. “Our Las Vegas properties are broadly distributed throughout the market and easily accessible, with over 90% of the Las Vegas population located within five miles of one of our gaming facilities.”
  2. “[W]e estimate that nearly half of the adult population of the Las Vegas metropolitan area are members of our Boarding Pass program and have visited one or more of our properties during the year ended December 31, 2015.”

(Check out our interactive map of “Station Casinos and the Las Vegas Regional Market“)

While these numbers may sound impressive, they also appear to leave little room for growth with respect to the company’s Las Vegas locals business. It is difficult to envision significant revenue bumps from building or acquiring more properties to cover the 10% of the population not currently living within a five-mile radius of an RRR property. In addition, if the company’s estimate is right a nd nearly half of the adult population in Las Vegas are members of its player rewards program, RRR will find difficulty signing up new locals since  a recent survey tells us that only slightly over half of the adult population gambles (see section below on “Local gaming behaviors”).

The flip side of the company’s saturation of the locals market means growth in its core Las Vegas business would have to come from significant increases in (1) the population of Las Vegas and/or (2) customer spending per capita. In this report, we examine available data to assess the likelihood of either happening. Our conclusion: facing low population growth and a decline in locals’ gaming behaviors, RRR is unlikely to experience much, if any, upside in its core Las Vegas locals business, which accounted for 92% of its net revenues and 89% of its adjusted EBITDA in the first quarter of 2016.

Las Vegas population trends

The Las Vegas metropolitan area has shown some growth in population over the past five years, in spite of a slight dip in 2011. However, what we are seeing now does not compare to the significant population growth Las Vegas experienced during the early to mid-2000s. Moreover, Las Vegas is unlikely to see the same kind of population boom like it did in the 2000s, according to expert projections.

From 2010 to 2015, the Las Vegas population grew 5.46% (Figure 1), compared to 26.5% population growth from 2002 to 2007 (Figure 2).

160802_RRRIPOdissected_fig1

160802_RRRIPOdissected_fig2

Annual population growth from 2010 to 2015 averaged 1.2% with a peak of 2.7% in 2013. From 2002 to 2007, annual growth averaged more than 4 times higher at 4.9% with a peak of 6.4% in 2004.

This kind of population explosion is not likely to return, according to projections by experts. Population forecasts show low, single-digit growth for the Las Vegas metropolitan area. The Nevada State Demographer’s Office predicts 0.9% annual growth rates or lower for 2017 through 2033 and UNLV’s Center for Business and Economic Research (CBER) estimates annual growth rates of 1.7% and lower from 2017 through 2050 (Table 1).

160802_RRRIPOdissected_tab1

With little population growth ahead, the Las Vegas locals market looks like a mature market that is unlikely to expand significantly. As 90% of the existing population already lives within five miles of one of the RRR properties, growth in the company’s core Las Vegas business would need to come from more customer visits and greater customer spending, not population expansion.

Local gaming behaviors

A useful source of information to gauge the health and growth potential of the Las Vegas locals market is the Clark County Residents Study commissioned by the Las Vegas Convention and Visitors Authority (LVCVA). These biennial studies are conducted with a random sample of 1,200 local participants and provide useful insights into locals’ gaming behavior and their overall entertainment spending patterns.

A comparison of the 2006 and 2014 Resident Study shows a significant decline in locals’ gaming activity, frequency, and budgets (Table 2).

160802_RRRIPOdissected_tab2

As we noted earlier, almost half (46%) of Las Vegas residents did not gamble in 2014, a percentage that rose significantly from the one-third (33%) who said they did not gamble back in 2006. In addition, how locals rank gambling among both their most frequent and favorite leisure activities, how often people gamble, and how much they budget for gambling are down across the board. These declining gauges of locals’ gaming behavior are consistent with what we have observed in the stagnant slot handle for the Las Vegas locals market, which we described in a previous report.

Since locals are gambling less and population growth is slow going forward, it is unclear how Red Rock can grow its core Las Vegas business.


Download this report

More Growth Questions about the Las Vegas Locals Gaming Market

Station Casinos has not entered any commercial gaming market outside of Nevada since it had to leave Missouri in 2000, while the gaming industry has expanded into many more new states since then. If investors seek a gaming company that can expand into multiple commercial markets outside of Las Vegas, be sure to ask Red Rock management what happened in Missouri. Station also aborted its online gaming venture within 2 years. But for tribal gaming, Station has been landlocked in Nevada.

All of these facts seem to warrant the classic warning for prospective investors: Do you want to put all your eggs in one gaming basket?

There has been little growth in overall gaming revenue in the Las Vegas locals gaming market since 2009. And Station Casinos has not noticeably gained market share.

Download our new report on growth questions about the Las Vegas locals market here.

Marc Falcone, Red Rock’s CFO, told the Nevada Gaming Control Board in January 2016 that

I do think we are encouraged by the backdrop of the economy. We do expect to experience additional growth. We think we are in the early stages of recovery, particularly in the locals business, and we are enthusiastic and excited about the backdrop, what we see economically and how that can translate into further growth across all revenue categories in our business today.

Yet economic data from federal agencies and gaming data from the Gaming Control Board suggest the current recovery in the Las Vegas area is moving slower than a previous post-recession recovery.

According to the National Bureau of Economic Research, there have been two recessions so far in the 21st century: one in 2001 and another that ended in June 2009. Four years after the first recession, Station Casinos opened its Red Rock Casino Resort & Spa.  Four years after the second recession, Station Casinos’ founding family is cashing out $460 million through the Red Rock Resorts IPO.

Comparing Recoveries in Las Vegas Economy

Post-Recession Growth Population ↑ Average Weekly Wages ↑ Number Employed ↑
2002 – 2006 22.3% 19.2% 24.5%
2011 – 2015 9.4% (through Aug.) 3.6% (through 3Q15) 13.5% (through 3Q15)

Recovery after the 2001 recession meant that, from 2002 to 2006, the population of the Las Vegas Valley grew by 22.3%, the average weekly wages of Clark County residents grew by 19.2%, and the total number of employed Clark County residents grew by 24.5%.  During the current recovery, from 2011 to 2015, the population of the Las Vegas Valley grew by 9.4%, the average weekly wages of Clark County residents grew by 3.6%, and the total number of employed Clark County residents grew by 13.5%.

Post-Recession CAGR Population ↑ Average Weekly Wages ↑ Number Employed ↑
2002 – 2006 5.2% 4.6% 5.6%
2011 – 2015 2.3% (through Aug) 0.3% (through 3Q15) 3.2% (through 3Q15)

Another way to compare these two sets of indicators would be to look at the growth rates.  Following the 2001 recession the population grew at a compound annual rate of 5.2% and the number of people employed grew at a compound annual rate of 5.6%.  In the four years after the more recent recession, not only did wages grow at a slower rate, but Las Vegas area population and the number of people employed grew at compound annual rate of 2.3% and 3.2%, respectively.

Recoveries and Tighter Slots in Las Vegas Locals Market

Post-Recession Growth Slot Unit Count Slot Handle Slot Handle
Avg Monthly Growth
Dec. 2002 – Dec. 2006 18.7% 36.2% $19.8 million
Dec. 2011 – Dec. 2015 11.5% ↑  1.1% $0.66 million


In the Las Vegas locals gaming market, from December 2002 to December 2006, slot unit count grew by 18.7%, while slot handle climbed by 36.2% at an average of $19.8 million per month over the four-year period. In the current era, from December 2011 to December 2015, slot unit count declined by 11.5%, while slot handle climbed by 1.1% at an average of $660,000 per month.

Furthermore, we identify a potential limit to the current recovery in terms of the slot win percentage, i.e., how tight the slots are.  From December 2011 to December 2015, total slot revenue amount grew 23.5%, while the slot unit count declined and slot handle was stagnant.  This growth in market-wide gaming revenue was made possible because slots got tighter.  Overall slot win rates (by the house) in the market went from 4.39% in December 2011 to 5.36% in December 2015, while slot win per unit per day rose 40%, from $75 per unit per day in December 2011 to $105 per unit per day in December 2015.

Growing casino revenue through tighter slots has its limits.  The addition of more slot units, by comparison, indicates confidence in expanding demand.  As noted in a previous report, when casino operators see their customers spend more on slots, they put more slots out on the floor.  This was the case between 2004 and 2006 when slot wagers in the locals market rose by 20%, and owners added 7,343 slots to the market.

If the Las Vegas locals market has reached an inflection point and is about to take off, why is Red Rock selling its specially zoned casino development sites? You have no doubt read in the prospectus and heard from the company that Station Casinos has taken advantage of a Nevada law that restricts new neighborhood casinos from being developed and has bought up the only available future casino sites so that they “own and control” their own destiny. So why are they selling some of these sites now? Is it a reflection of what those economic numbers could be telling them about the future of their core business?


Red Rock Resorts is a Second-Class Gaming IPO

Download our unauthorized roadshow presentation and presentation notes here.

Investors who buy Red Rock’s second-class shares on offer will gain a minority (33%) stake in the once-bankrupt Las Vegas casino and tavern operator, Station Casinos. The terms of the offering beg questions about company insiders’ confidence in its long-term prospects.

Prospective investors should ask management the following questions:

Should new shareholders expect significant dilution soon after the IPO thanks to Deutsche Bank’s expected exit? After the IPO, Deutsche Bank owns 16.2-18% of the company after selling very few shares in the current offering. The German lender, which is also an underwriter of this IPO, has been selling off its non-core assets at a loss, including a Las Vegas Strip resort and a New Jersey port operator as it continues to deal with its capital and regulatory challenges. Will it sell off its large Station Casinos/Red Rock stake immediately after the 180-day lock-up period, which may even be waived by Deutsche Bank and J.P. Morgan as underwriters?

Why is Red Rock paying $460 million in cash to insiders to internalize management with the Fertitta Entertainment acquisition? Red Rock’s prospectus does not present any specific potential benefits of this proposed transaction, yet the price represents (1) 20% of the $2.3-billion IPO valuation of Station Casinos’ equity at the mid-point of its offering price range; (2) 8.7x TTM management fees instead of the 1x TTM management fees for a potential termination of the Fertitta Entertainment management agreements covering at least 13 of 19 casinos; and (3) 31x our estimate of Fertitta Entertainment’s 2015 pro forma EBITDA of about $14.8 million. Even though it did not complete a $300-million dividend recapitalization last spring, Station Casinos has paid out over $477 million to its existing owners from 2013 through April 2016, before consummating this pricy acquisition.

How confident is management in Red Rock’s growth prospects? The Las Vegas locals market, which made up over 90% of Red Rock’s total EBITDA in 2015, has been contracting in terms of total amount wagered and number of slot units, and gaming revenue at the company’s Las Vegas operations grew at an annual compounded rate of only 1.4% from 2012 to 2015. The company has even listed hard-to-come-by potential casino sites in Nevada for sale. As for its tribal business, the company has not signed any new tribal gaming development or management agreements since 2004. Its two current contracts are due to expire in 2018 and 2020, with only one more project in development.

If the Fertitta family is cashing out, why should investors buy Red Rock’s second-class shares with uncertain prospects for dividends? The Fertitta family’s Class B Red Rock shares with 10:1 voting power make the Class A Red Rock shares second-class shares in more ways than one. Furthermore, a lopsided tax receivable agreement without a hard cap on future payments to pre-IPO owners will lead to uncertainty about Red Rock’s future free cash flow and its ability to pay dividends to Red Rock’s second-class shareholders.

It is alarming that potential investors in Red Rock’s second-class IPO are being asked to buy out an insider management company at a high, $460-million valuation, instead of paying down company debt or funding new growth initiatives. Data on the ground in Las Vegas show tepid growth in Red Rock’s core business, underscoring the contrast between an IPO that strengthens a gaming company’s finances and one that drains funds to buy a related-party management company, like Red Rock.


See more of our analysis of the Red Rock Resorts/Station Casinos IPO:


Why is Station Casinos Selling Valuable Casino Sites?

See also: More growth questions about the Las Vegas locals gaming market.


In Red Rock Resorts’ most recent S-1/A, the company says it “control[s] approximately 398 acres of developable land comprised of seven strategically-located parcels in Las Vegas and Reno, Nevada, each of which is zoned for casino gaming and other commercial uses” (3/15/16 S-1/A, p. 116). The filing then lists seven such parcels: Durango/I-115 (70 acres), Wild Wild West/Viva (96 acres), Flamingo/I-215 (58 acres), Via Inspirada/Bicentennial Parkway (45 acres), Boulder Highway (30 acres), Mt. Rose Property (Reno) (88 acres), and South Virginia St/I-580 (Reno) (8 acres).

Two of these sites caught our eye, because they are actually on the market. There is no guarantee that IPO investors will be able to participate in any potential growth tied to these parcels, if they are soon sold off.

The large Mt. Rose site in Reno has been on the market since at least November 3 last year, less than a month after the company made its initial IPO filing on Oct 13.

A 25.5-acre portion of the company’s 30-acre Boulder Highway site in Las Vegas has also been on the market for a while. The parcel for sale is not itself entitled for gaming development, leaving a 5-acre rump for a future casino. The earliest listing we saw was from October 28.

It is unclear why Red Rock does not disclose in its prospectus that these two parcels are currently listed for sale. This lack of disclosure is all the more puzzling given that the company does say that another gaming-entitled parcel in its land bank is for sale – immediately after it lists off the seven parcels mentioned above: “We also own an additional development site in Las Vegas that is zoned for casino gaming and other commercial uses and which is currently for sale.”

This likely refers to what one might call the “Cactus/I-15 site”, which is located off the new Cactus Avenue ramp of I-15 south of the Las Vegas Strip. This parcel has also been on the market since at least October 28, and it is being sold “with a deed restriction precluding any gaming on entire site.” (Station Casinos had announced a “Cactus Station” project at this location back in November, 2008, before the highway exchange was built.)

Gaming-entitled land has been a scarce commodity since Nevada State Senate Bill 208 (“SB 208”) was enacted in 1997 to significantly limit the construction in large urban communities such as Las Vegas/Clark County and Reno/Washoe County. As Red Rock tells prospectus investors, one example of the ability of its “highly-experienced management team, led by the Fertitta family,” to create value has been their “capitalizing on the opportunity created by Nevada’s passage of SB 208 through a series of strategic acquisitions and new developments” (S-1/A, 3/15/16, p. 4). Furthermore, the company believes that “the development of new casino facilities will continue to be limited due to SB 208, which limited casino gaming in the Las Vegas valley to specified gaming districts and established more restrictive criteria for the creation of new gaming districts” (S-1/A, 3/15/16, p. 8). One would thus expect any large, gaming-entitled parcels – such as the ones the company has put on the market – to continue to be quite valuable.

Investors should ask Red Rock Resorts/Station Casinos and its IPO underwriters:

  • Why is the company selling valuable casino sites?
  • Where will growth come from if the company is selling off future casino sites?
  • Does the Fertitta-led management team not see value in these parcels?
  • Do they not see growth opportunities that can be realized by developing these sites?
  • Do the Fertittas and other executives of Red Rock have confidence in the company’s core Las Vegas locals business?

See more of our analysis of the Red Rock Resorts/Station Casinos IPO:

Selling Growth While Cashing Out

Read our updated report, “Selling Growth While Cashing Out”.

Is the Las Vegas locals market in decline? Data from the Nevada State Gaming Control Board show a continuing decline in the number of slot machines in the Las Vegas locals market since 2009. This is accompanied by a similar decline in the total amount wagered by customers in the locals market. Both total slot units and amounts wagered have declined to 2003 levels. Station Casinos derives “approximately 80% to 85%” of its gaming revenue coming from slot play.

Why is Red Rock Resorts selling hard-to-come-by casino sites? Historically, Station Casinos built its leading position in the Las Vegas locals gaming market by acquiring a portfolio of competing locals casinos and undeveloped land shielded from competition thanks to Nevada’s SB 208 legislation. The company touts its gaming-entitled land holdings in its IPO prospectus, but it has not disclosed that some of its casino sites are now on the market or explained why it is ceding some of its “highly desirable” and “strategically located” gaming-entitled locations in Las Vegas.

When will Red Rock Resorts grow again? Station Casinos has seen little growth in its core Las Vegas business over the last several years. Casino revenues from its properties in Las Vegas barely increased from 2009 to 2014, with a compound annual growth rate of only 0.07%. A significant portion of the company’s EBITDA growth over the past three years has come from its tribal casino management agreements, but the company has not signed a new tribal casino development agreement in over a decade.

Investors deserve better analysis of Las Vegas economic conditions. We reviewed how the company in its IPO filings describes certain of its own key metrics for understanding the Las Vegas economy and the potential for growth in the Las Vegas locals gaming market (e.g. average weekly wages and home value appreciation). When Station Casinos says that it believes the Las Vegas locals gaming market is one of the most attractive in the U.S. because of, among other things, “its strong economic and demographic fundamentals,” what is the company talking about? How confident is the company in its claims?